This page contains information for teachers and instructors who use NII's online analysis system for classes and seminars.
What you can do
- You can use the analysis environment of Jupyter Notebook and RStudio in your browser.
- There is no need to have the analysis environment installed on the student's computer.
- The analysis environment can include programs, data files, and dependent packages.
- Students can rebuild the same analysis environment with a single click, and there is no need to install additional packages.
Account Requirements
In order to use this system, instructors and students must each log in using one of the following methods.
- (a) Log in with the account of your own institution (university, etc.)
This method can be used if your institution is a member of the Academic Access Management Federation in Japan (GakuNin) and has already completed the initial settings for linking with this system. The initial setup should be done by the department in charge of information infrastructure at your institution. For details, please consult the person in charge below.
- (b) Log in with an OpenIdP account
- This method is available for users with an email address in the ac.jp or go.jp domain. If you are an institution with a domain name other than that, please contact the person in charge below for individual support.
- This method is for those who do not meet the requirements in (a) above to try out the system. If you want to use the system in a class, we recommend you to use the method (a). For details, please contact the person in charge below.
- If you are using OpenIdP for the first time, please refer to How to Use OpenIdP.
Operating environment
It is assumed that both the instructor and the student have the following environment.
- One of the following browsers: Chrome, Firefox, Safari, Edge.
- Permanent Internet connection
How to create an analysis environment
In this section, we will show an example of how to use this system for a class using "Rで学ぶデータサイエンス 14 計量政治分析』(Kyoritsu Shuppan) " as the textbook.
- Create a repository on GitHub for the class, and place the environment configuration information (see below), programs and data files (if any) that will be used as teaching materials.
- In this example, we will use https://github.com/ikfj/ds-polimetrics as the repository for the class.
- In this repository, apt.txt and environment.yml are the environment configuration information and prepare.r is the teaching program.
Depending on the repository you are actually using, you may need to change the following description.
- Open https://binder.cs.rcos.nii.ac.jp/ in your browser.

- Enter the URL of the repository in the [GitHub repository name or URL] field at the top.
- In our example, we'll enter https://github.com/ikfj/ds-polimetrics.
- Copy the URL that appears under [Copy the URL below and share your Binder with others:].
- In this example, it is https://binder.cs.rcos.nii.ac.jp/v2/gh/ikfj/ds-polimetrics/master.
- Press the [Launch] button.
- Select your institution or OpenIdP in the affiliation selection and click the [Select] button.
- Authenticate with your own institution or OpenIdP account.
- A new analysis environment for you will be created.
- Give the URL copied in Step 4 to the student.
The environment configuration information to be created in Step 1 is a text file describing the packages to be installed in the analysis environment. apt.txt describes the OS (Ubuntu) package, environment.yml describes the conda package, and so on. For more information on how to install other packages, please refer to https://mybinder.readthedocs.io/en/latest/using/config_files.html or contact the person below.
How to use the analysis environment
- Open the URL given by the instructor in your browser.
- In this example, it is https://binder.cs.rcos.nii.ac.jp/v2/gh/ikfj/ds-polimetrics/master.
- Select your institution or OpenIdP in the affiliation selection, and click the [Select] button.
- Authenticate with your institution's or OpenIdP's account.
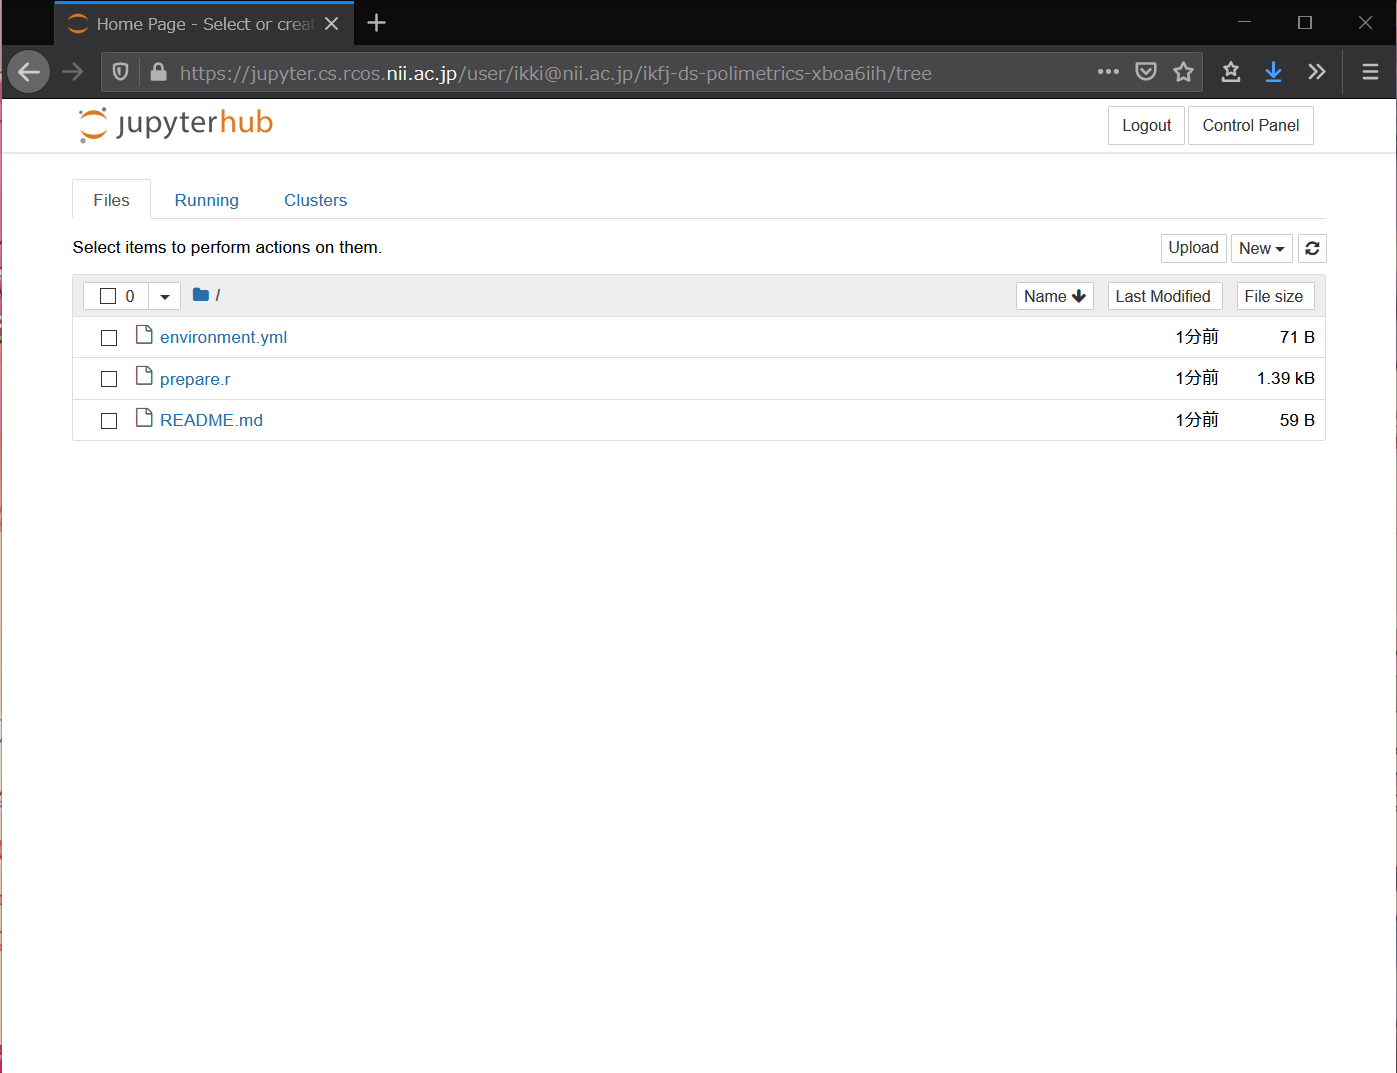
A new analysis environment for you will be created.
- Click New → RStudio on the right side of Files. RStudio will open in a new tab.
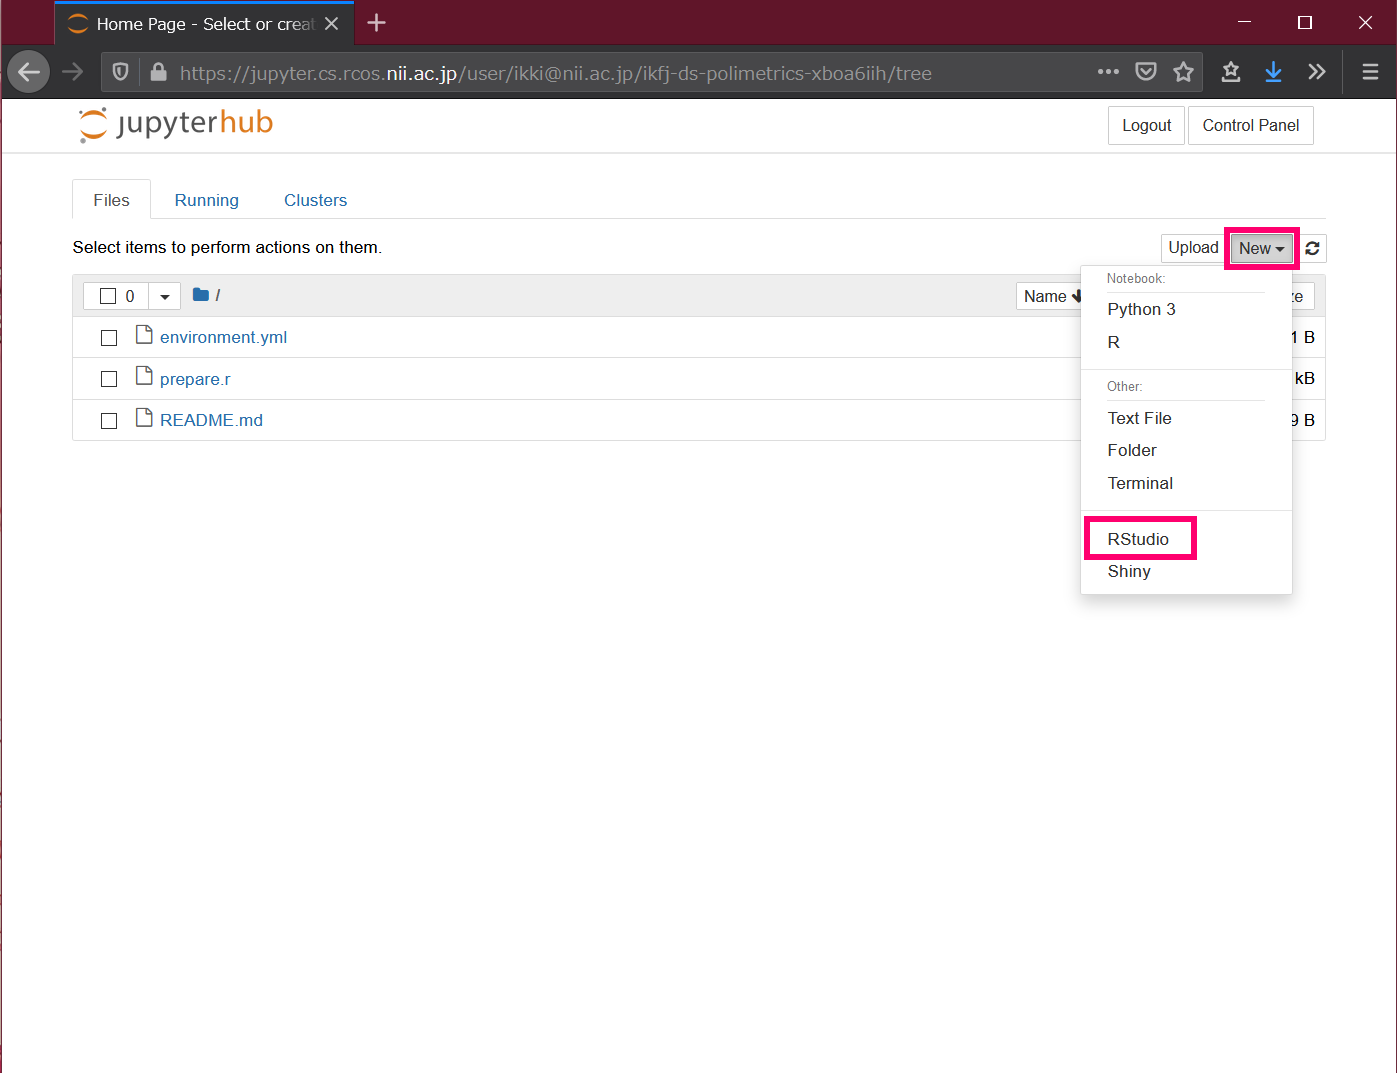
- Follow the instructor's instructions to use RStudio.
Note that a new analysis environment is created each time the URL is opened in step 1. This means that if you open this URL twice, the learner will have two analysis environments. A student can have up to 20 analysis environments.
When you are finished, save the modified file and close the browser. The analysis environment will not be lost when you close the browser.
To resume work in your own analysis environment that you created earlier
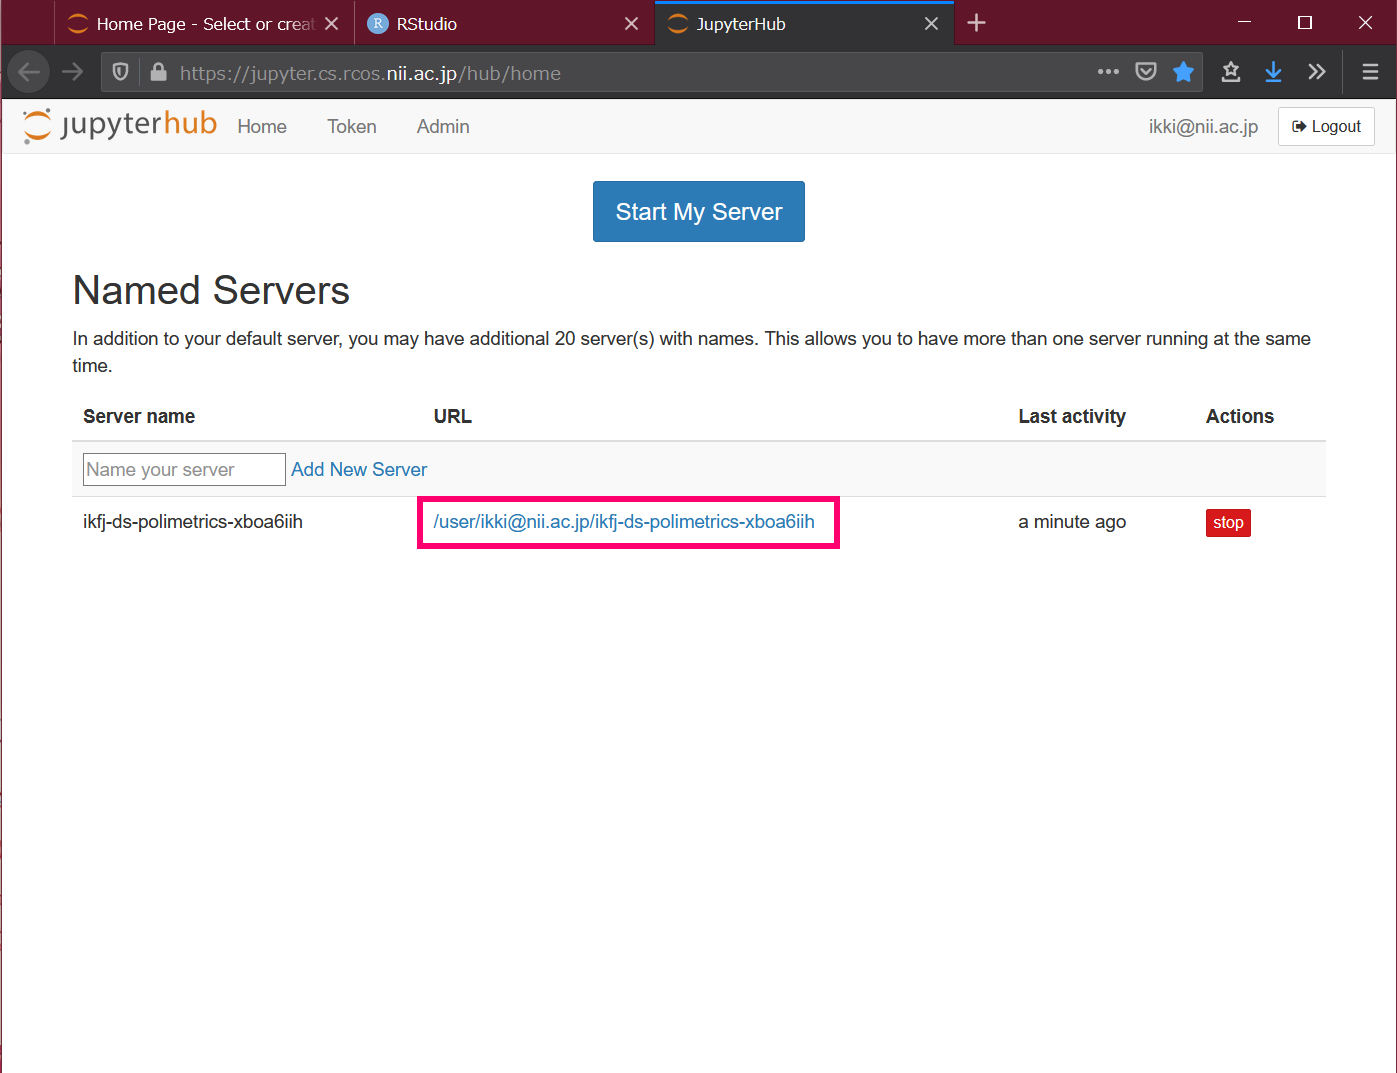
- Open https://jupyter.cs.rcos.nii.ac.jp/ in your browser.
- Click on the URL under Named Servers. If you have created multiple analysis environments, the URL for each will be displayed.
To remove an unwanted analysis environment
- Open https://jupyter.cs.rcos.nii.ac.jp/ in your browser.
- Press the [stop] button on the right side and wait for a while.
- Press the [delete] button that appears on the right side.
Contact Information
Research Center for Open Science, National Institute of Informatics
Ikki Fujiwara, Online Analysis System <cs-support@nii.ac.jp>